How to fetch additional data for a flux query from a json file

My buddy Romses is currently taking care of the Datenzwerg deployment at 38c3, and like at every event where we deploy them I’m updating our page and Grafana dashboard with the locations of the gnomes. So far the latter was always quite annoying: We have only the names of the gnomes in our influx data, and adding the location/deployment status to the graph thus meant having something like this for every single graph:...

December 26, 2024 · 2 min
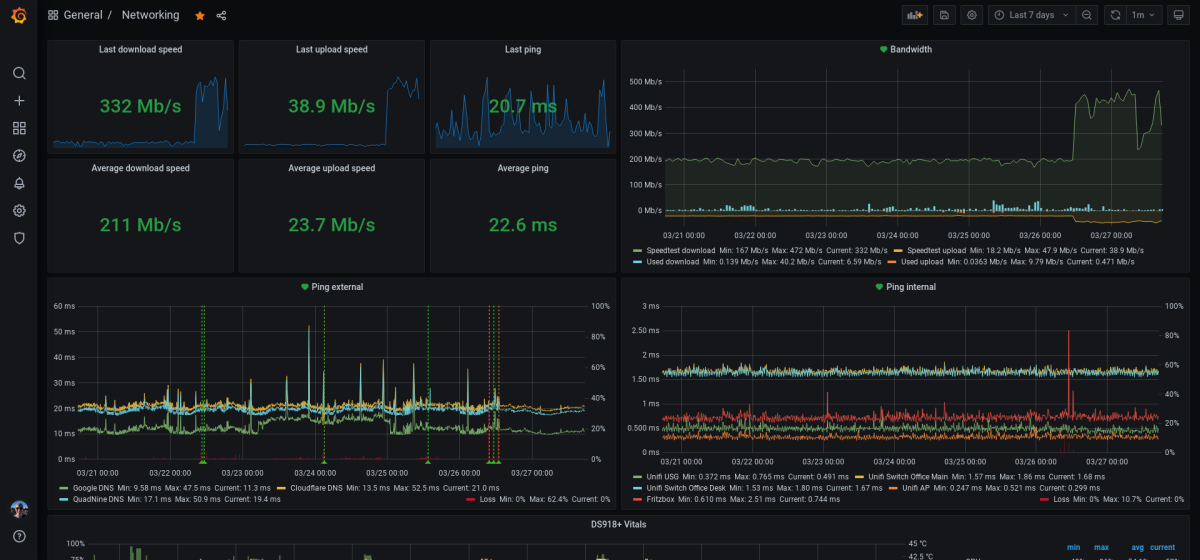
My networking dashboard in Grafana with speed and latency monitoring

Homelab uplink monitoring

For a bit more than two years now I’ve been closely monitoring my network uplink. In the past I had a ton of issues with up- or download speeds not being what I paid for, packet loss issues and outright full blown outages. In order to put myself into a better position when reaching out to the ISP’s support hotline I figured it would be good to be able to proof not only the existence of these issues but to also be able to determine the exact times they happened at and also to verify and show that in fact it was only external connections that were suffering and it was not an issue with my own internal network....

March 28, 2021 · Updated March 31, 2021 · 7 min
Mastodon